|
Rank |
Local authority |
Region |
Annual emissions (tCO2) |
Annual trees needed to offset carbon footprint |
|
1 |
North Lincolnshire |
Yorkshire and the Humber |
7,445,200 |
1,489,040 |
|
2 |
Neath Port Talbot |
Wales |
6,505,800 |
1,301,160 |
|
3 |
Birmingham |
West Midlands |
4,129,400 |
825,880 |
|
4 |
Leeds |
Yorkshire and the Humber |
3,904,900 |
780,980 |
|
5 |
Cheshire West and Chester |
North West |
3,620,400 |
724,080 |
|
6 |
High Peak |
East Midlands |
2,832,900 |
566,580 |
|
7 |
Fife |
Scotland |
2,804,900 |
560,980 |
|
8 |
Wiltshire |
South West |
2,694,500 |
538,900 |
|
9 |
Cornwall |
South West |
2,690,900 |
538,180 |
|
10 |
East Riding of Yorkshire |
Yorkshire and the Humber |
2,660,900 |
532,180 |
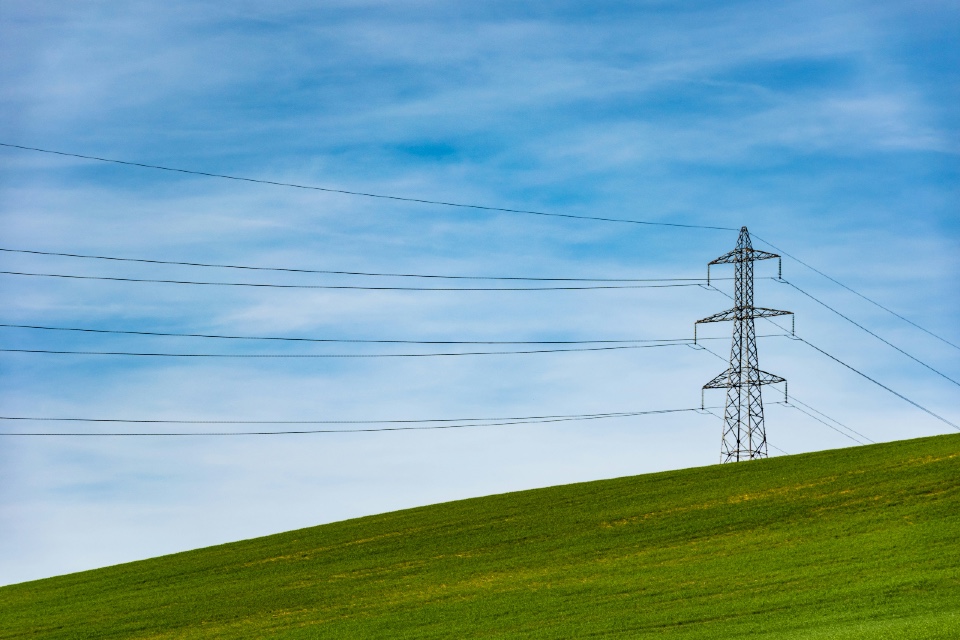
North Lincolnshire is the local authority that requires the highest number of trees to offset its CO2 emissions as it’s home to the Tata-owned Appleby-Frodingham steel plant, one of the largest and most successful steelworks in Europe. With annual emissions of 7,445,200 tCO2, the area needs to plant 1,489,040 trees to make it carbon neutral.
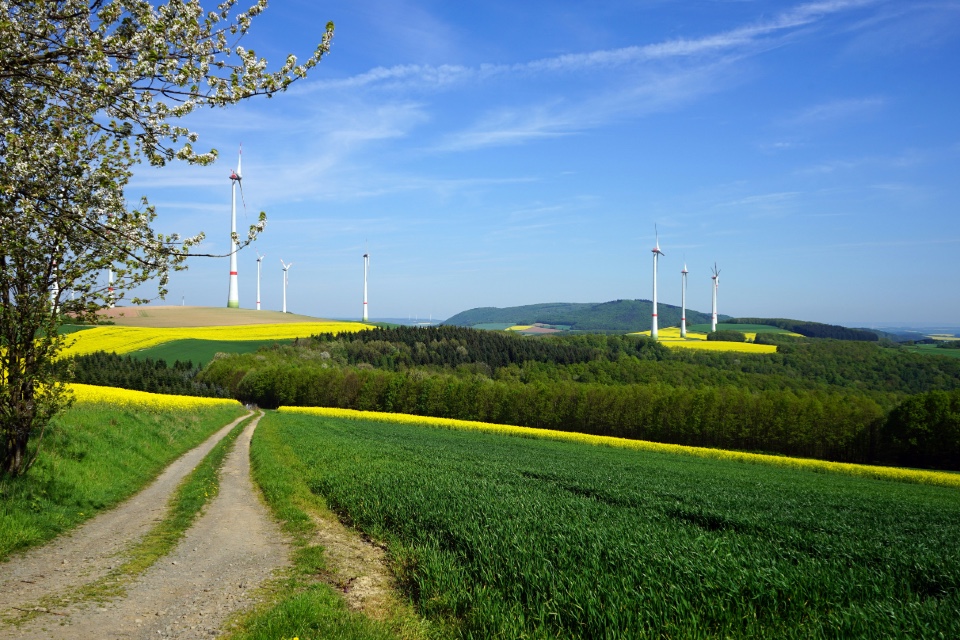
Neath Port Talbot followed in second place, needing 1,301,160 trees to offset their carbon emissions of 6,505,800 tCO2.
Two of the country’s major cities filled the next two spots as Birmingham and Leeds took third and fourth place respectively.
|
Rank |
Local authority |
Region |
Emissions (tCO2) |
Annual trees needed to offset carbon footprint
|
|
1 |
Isles of Scilly |
South West |
9,400 |
1,880 |
|
2 |
Argyll and Bute |
Scotland |
57,500 |
11,500 |
|
3 |
Oadby and Wigston |
East Midlands |
179,300 |
35,860 |
|
4 |
Highland |
Scotland |
190,200 |
38,040 |
|
5 |
Orkney Islands |
Scotland |
192,400 |
38,480
|