UK Archives - Energy Management Summit | Forum Events Ltd

Energy Management Summit | Forum Events Ltd Energy Management Summit | Forum Events Ltd Energy Management Summit | Forum Events Ltd Energy Management Summit | Forum Events Ltd Energy Management Summit | Forum Events Ltd

Posts Tagged :

UK

UK ranks third amongst the countries that have reduced emissions the most

960 640 Stuart O'Brien
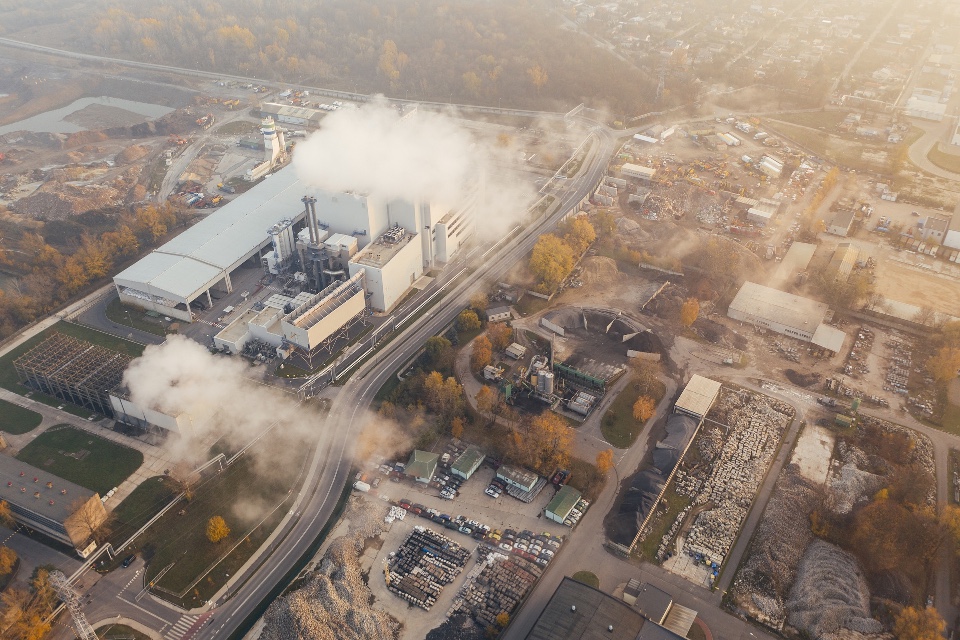
The United Kingdom is one of the few countries that managed to actually reduce their CO2 emissions in the last 60 years.
The report by Utility Bidder analyses various countries’ emissions from 1959 and 2019, to reveal who has made the most cuts to their emissions, and predict who will be the worst offenders for co2 emissions in 2032.
Top five countries that have cut emissions the most

Rank

Country

1959 emissions (MtCO2)

2019 emissions (MtCO2)

Annual change

Estimated 2032 emissions (MtCO2)

1

Curaçao

11.0

3.7

-1.78%

2.8

2

Moldova

11.0

7.3

-0.66%

6.7

3

the United Kingdom

545.9

370.1

-0.64%

339.5

4

Ukraine

256.5

223.5

-0.23%

217.0

5

Germany

754.8

703.5

-0.12%

692.9

Only five of the 93 nations saw their emissions decrease in the last 60 years, with the Caribbean island of Curaçao achieving the biggest decrease at -1.78% per year.
Moldova’s emissions have fallen by an average of 0.66% over the last 60 years. if they continue to do so at the same rate, they’ll have fallen to 6.7 MtCO2 by 2032.
Whilst still being one of the countries with the highest emissions, the UK has seen its emissions fall in the last 60 years, from 545.9 MtCO2 in 1959 to 370.1 MtCO2 in 2019.
The countries with the biggest emissions increase 

Rank

Country

1959 emissions (MtCO2)

2019 emissions (MtCO2)

Annual change

Estimated 2032 emissions (MtCO2)

1

Saudi Arabia

3.7

582.6

8.66%

1,238.8

2

Thailand

3.7

289.5

7.43%

568.9

3

Malaysia

3.7

249.2

7.16%

481.1
Saudi Arabia’s emissions grew by  578.9 MtCO2 over the last 60 years, and the annual change is estimated at 8.66%. This increase is expected given the country’s role as the leader in the world’s petroleum industry.
Thailand Increased its emissions by 285.8 MtCO2 since 1959, so it could hit 568.9 MtCO2 by 2032. It is largely due to the simultaneous economy and population growth that the country experienced over the last 60 years.
Malaysia Increased its emissions by 245.5 MtCO2, meaning it could hit 481.1 MtCO2 by 2032.
Further findings: 
The countries with the lowest estimated 2032 emissions:
  • As well as being the country that has cut its emissions the most since 1959, Curaçao is also the nation that has the lowest predicted emissions by 2032, at just 2.8 MtCO2.

  • Democratic Republic of the Congo is at the second-lowest estimated emissions, reaching 3.7 MtCO2 by 2032. The DRC is also home to the second-largest tropical rainforest in the world, which acts as a carbon sink.

  • Moldova has the third-lowest estimated emissions for 2032, with 6.7 MtCO2.

Norway leading the way on renewable and UK slips behind

960 640 Stuart O'Brien
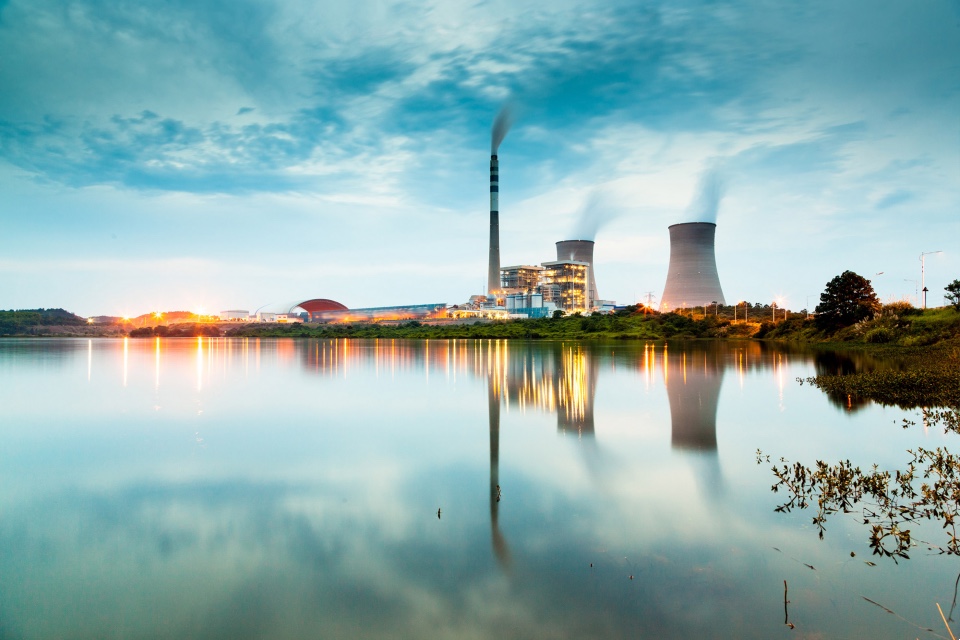
Research has found Norway is the world leader in renewable energy use, making up 56% of its total energy supply, while the UK ranks 20th as renewable energy only accounts for 13%.
A study by energy tariff comparison platform Utility Bidder has revealed which countries rely the most on fossil fuels (coal, oil and natural gas) renewable energy (hydropower, biofuels and waste, wind and solar) and also nuclear energy to reveal the distribution of energy sources around the world.
The top 5 countries with the highest share of renewable energy

Rank

Country

Total energy supply (ktoe)

Renewable energy supply (ktoe)

Renewable energy as % of total supply

1

Norway

23,753

13,308

56%

2

Brazil

289,130

133,460

46%

3

New Zealand

20,589

8,641

42%

4

Sweden

49,204

20,115

41%

4

Denmark

16,011

6,529

41%

5

Finland

32,031

11,866

37%

20

UK

169,543

22,842

13%

Norway uses the biggest share of renewable energy in the world, making up 56% of its total energy supply. It also utilises hydropower more than any other country as that accounts for 45% of its supply alone. The country is known for being experts in the field of hydroelectricity with many steep valleys and rivers, as well as increased rainfall due to climate change, meaning hydroelectricity is a fruitful opportunity.

With the second highest supply of renewable energy, Brazil is also the leader in biofuel and waste energy, which accounts for 32% of its total energy supply. Brazil is the second-largest producer of ethanol fuel and is an industry leader, with its sugarcane-based ethanol being touted as the most successful alternative fuel to date, based on advanced agri-industrial technology.

Renewable energy sources in total account for 42% of New Zealand’s energy supply. It is also the world leader in wind and solar energy which makes up 25% of New Zealand’s energy supply. Situated in the path of the ‘Roaring Forties’, a set of strong and constant westerly winds, the nation is perfectly positioned for wind power and enjoys plenty of sunshine for solar energy too, as well as having an increasing market for solar hot water heating systems.

The top 5 countries with the highest share of fossil fuels

Rank

Country

Total energy supply (ktoe)

Fossil fuel energy supply (ktoe)

Fossil fuels as % of total supply

1

Singapore

37,752

37,062

98%

2

Australia

132,431

122,927

93%

3

South Africa

134,645

122,398

91%

4

Luxembourg

3,453

3,122

90%

4

Netherlands

70,715

63,733

90%

4

Morocco

20,295

18,260

90%

5

Mexico

184,021

164,657

89%

18 UK
169,543
132,062
78%

Singapore relies on fossil fuels more than any other country, with 98% of its total energy supply coming from traditional fuel sources. It uses the highest proportion of oil in the world relative to total energy supply, as oil makes up 73% of Singapore’s supply. It is home to major oil companies such as Exxon Mobil, due to its ideal trading location and perceived safe environment.

Australia follows closely behind as the second most reliant on fossil fuels as this makes up 93% of its total energy supply. It is relatively evenly split between coal, oil and natural gas as each accounts for 31%, 33% and 29% of the total energy supply respectively.

While being the third most reliant on fossil fuels, South Africa also uses the highest proportion of coal in the world standing at 73% of its total supply. This is largely because coal is one of the most affordable fuel sources, but also due to a lack of real alternatives in the country too.

The Netherlands ranks joint fourth overall and also has the highest supply of natural gas than any other country, standing at 45% of its total energy supply. Fifty percent of this comes from the Groningen gas field, the largest gas field in Europe, however, the Dutch government has committed to stop regular production from the Groningen field by 2022.

The top 5 countries with the highest share of nuclear energy

Rank

Country

Total energy supply (ktoe)

Nuclear energy supply (ktoe)

Nuclear energy as % of total supply

1

France

246,349

103,966

42%

2

Sweden

49,204

17,349

35%

3

Switzerland

24,884

6,916

28%

4

Slovakia

16,318

4,110

25%

5

Belgium

55,162

11,341

21%

12 UK
169,543
14,639
9%

France is the leading country when it comes to nuclear energy, making up 42% of its energy supply, with 56 operational nuclear reactors producing 103,966 ktoe – the second largest amount produced, just behind the USA which produces 219,737 kote of nuclear energy which equates to 10% of its energy share.

Widespread ‘net zero’ scepticism among UK public

1024 682 Stuart O'Brien

The majority of the UK public are sceptical about achieving the net zero target, with 58% believing that it is unlikely that the target will be achieved even by 2050.

Bright Blue, the independent think tank for liberal conservatism, has published analysis of UK public attitudes to the target of net zero carbon emissions by 2050, entitled Going greener? Public attitudes to net zero.

The report explores attitudes to the credibility of, responsibility for, and policies to achieve net zero, with key finding including:-

  • National governments are seen to have the highest responsibility for achieving the target. 82% of the public assign them a high degree of responsibility. Strong majorities also think businesses (82%), local governments (78%), and members of the public (74%) have a high degree of responsibility.
  • Public awareness of how various activities contribute to greenhouse gas emissions is generally strong. Although the extent of these perceptions varies between activities, from 77% of the public seeing flying on aeroplanes as a significant contributor to climate to 56% for production of food on farms.
  • A majority of the public think that people will need to undertake a number of changes in their behaviour to help achieve net zero.This includes recycling more (63%), installing better home insulation (53%), reducing air travel (52%) and buying and driving an electric car (52%). Eating less meat was the lowest supported change of behaviour (34%). Only 10% of people thought most people would not have to make any changes.
  • Much of the public are already making changes to reduce greenhouse gas emissions. A majority of the public (72%) already reuses and recycles more products, while a plurality is buying more locally produced goods (43%), has installed home insulation (43%), used more cycling or public transport (35%) and eaten less meat (35%).
  • The public has a significant expectation of price increases to achieve net zero. They expect prices will go up greatly or slightly on all types of products and services that we have polled if we take action to achieve net zero. Airplane tickets see the greatest expectation in higher prices, with 67% believing they will increase. The public is split on whether they actually would be willing to pay more for these products and services where higher prices would lead to lower emissions. People are most likely to be willing to pay more for products where they also have the lowest expectation of higher prices, such as electronic goods (46% willing to pay more), food (46%) and clothing (45%). In contrast, household electricity and home heating, both of which are most likely to be believed to face price increases as a result of net zero, are also products where a majority of people (52% and 51% respectively) say they would not be willing to pay more for them to lower emissions.
  • The public prefers a ‘carrot’ over ‘stick’ approach to achieving net zero. The public prefers policy approaches which use financial incentives to encourage environmentally friendly practices for individuals (49%) and businesses (45%) over laws and regulations that discourage or punish choices by individuals (34%) and businesses (38%).
  • There are high levels of support for a range of government policies for achieving net zero. This includes requiring firms that work for government to assess and report on their carbon footprint (66%), providing tax breaks for businesses which have cut emissions (59%), introducing a carbon tax (52%), taxing investment in fossil fuels (51%), establishing a new emissions trading scheme for businesses (50%) and installing smart meters in all homes and businesses (49%).
  • There is public support for government subsidies to help with decarbonisation. A majority of the public support government subsidies for installing better home insulation (69%), using an electric car (64%), switching away from natural gas heating in homes (62%) and using cycling or public transport as main methods of travel (53%). But the public opposes government subsidies for reducing air travel, with 35% supportive and 43% opposed, and eating less meat, with 27% supportive and 52% opposed.
  • There is strong support for subsidies for low-income households and small businesses. There is also broad public support for subsidies to help with at least some costs of decarbonisation changes, such as insulation, for low-income households (81%) and small businesses (80%). 27% of the public thinks that low-income households should receive help with all of the costs, and 29% think so about most of the costs, indicating that most of the public would support significant government action. In contrast, only 15% think that small businesses should receive help with all of the costs, indicating that the public wishes to aid them in a more limited manner.
  • The public believes that many businesses aren’t taking enough action to reduce emissions. The public is most critical of airlines, with 50% believing they are not taking enough action. More people are critical than not of: industrial manufacturers, gas companies, car makers, high street shops, electricity companies, container shipping firms, housebuilders, and supermarkets. The farming industry is the only industry that more people believe are doing enough than not enough, with 33% believing they are and 27% believing they are not.
  • There is a high level of support for specific actions by businesses to help achieve net zero greenhouse gas emissions as long as they do not impact prices. A majority supports businesses investing profits into sustainable technologies and practices (68%), offsetting greenhouse gas emissions (63%), creating internal targets for achieving net zero greenhouse gas emissions (62%), publishing detailed breakdowns of emissions from business activities (62%) and making consideration of emissions a key factor in decision-making (62%). However, support for increasing charges to customers to cut emissions is low (29%).
  • Public familiarity with low-carbon heating technologies remains relatively low. Only 42% of the British public have heard of heat pumps, which is the system with the highest familiarity, in comparison to 46% who have not heard of them. People are even less familiar with hybrid boilers (27%), hydrogen boilers (21%) and heat networks (18%). As such, there is relatively low interest in replacing the existing heating method with a low-carbon heating system such as hybrid boilers (44%), heat pumps (44%), hydrogen boilers (35%) and heat networks (32%). A large number of the public did not provide a response, likely due to the low familiarity.
  • The public prioritises functionality, cost, and ease of use over a low carbon footprint for home heating systems. A majority of the public think that having a residential heating system with a low carbon footprint is important (67%). However, control functions such as being able to use it at any point (86%), heating up quickly (84%) and ownership (75%), are seen as more important as well as being lower cost than alternatives (78%) and being familiar (77%). While reduction in greenhouse gas emissions is a motivating factor for installing a new home heating system for the majority of the public (68%), other factors including running costs (83%), having reliable information (82%), cost of replacement (80%), ease of procuring and installation (77%), and ownership (71%) are more popular reasons.
  • There is a high degree of familiarity among most of the public regarding home energy efficiency measures. Double glazing (88%), loft insulation (87%), wall insulation (85%), energy-efficient lighting (84%) draught-proofing windows (79%) and under floor insulation (77%) are all being widely recognised. Levels of installation of different energy efficiency measures closely follow knowledge of them, with double glazing (51%), loft insulation (46%), wall insulation (39%), energy-efficient lighting (34%) and draught-proofing windows (30%) already being installed by a notable proportion of the UK public.
  • The public sees a range of benefits and drawbacks from adopting these energy efficiency measures. These include making energy bills cheaper (69%), reducing greenhouse gas emissions (52%) and making the house more comfortable to live in (49%) being seen as the most important benefit, while high initial costs (62%), disruption during installation (36%) and future costs in maintaining the measures (31%) seen as the key drawbacks.

Anvar Sarygulov, Senior Researcher at Bright Blue and report author, said: “The changes that need to be made by individuals, businesses and government to help achieve net zero are demanding and disruptive. The public recognises that the government, businesses and individuals themselves have a lot to contribute to help Britain achieve its climate change goals, and are receptive to a variety of policies and behavioural changes to help make it happen. However, if it means increased prices on home electricity and heating, the public are opposed to action.

“Ambitious, sometimes radical, action will be needed across economic sectors. The public will need to accept, and adapt to, significant changes in the goods and services they consume. Many are still unaware of and unprepared for the changes required, especially in the way they heat their homes, to ensure we can reach net zero by 2050. Government and businesses must do more to inform and prepare the public for the changes that need to happen, or they risk the public turning against necessary decarbonisation.”

The full data tables for the polling can be found here.